This is inspired by the paper ‘Mean field dynamics of stochastic cellular automata for random and small-world graphs’1, which goes beyond depression and stochastic cellular automata.
As opposed to typical ‘latent factor models’ of psychopathology (mental illness), whereby an illness like depression is caused by some underlying mechanism, independant from its symptoms, there are ‘network models’ that treat the symptoms of an illness as being the cause of each other (see Robinaugh et al., 20202 for a review).
The model illustrated above follows that second approach, modelling each symptom of depression (I arbitrarily chose 16 symptoms from Fried, 20173) as a node in a network of cellular automata (Conway’s game of life is a well-known example of cellular automata). This means that whether or not a symptom is present depends on some rule that refers to the presence or absence of the rest of the symptoms in the network.
In the example above, I use the rule described in the paper1. This says that if fewer than or equal to half of a node’s neighbours are active (black), the probability that the node will become active is \(p\) (which you can adjust with the slider). If more than half of a node’s neighbours are active, its probability of activation is 1-\(p\).
Each node has 5 neighbours: a node to its left, to its right, above it, below it, AND itself in its previous state. Where nodes do not have visible neighbours, dotted lines represent a connection to the node on the opposite side of the grid.
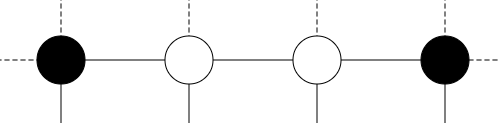
For example, the node on the left and the node on the right are neighbours.
Something interesting (and possibly realistic) about this model is that it is bistable at low values of \(p\). For example, if \(p\) is very low (but not 0), it is likely that the network is either very active or very inactive, with some chance of transitioning from one state to the other. Set \(p\) to 0.15 and speed up the animation to see this effect quite clearly. When \(p\) is even lower, it might take a while for you to see a transition between states of activity.
One way this model may not be particularly realistic is that symptoms are either on or off. However, symptoms of depression (and other mental illnesses) are often treated this way during diagnosis, so the model may still be clinically relevant.
For a better discussion of the model, see Waldorp and Kossakowski (2020)1. They also expand on how to summarise the model in more useful ways (through the mean field of the network), but the mathematics is beyond me at the moment. I might implement it here when I better understand.
References
- Waldorp, L., & Kossakowski, J. (2020). Mean field dynamics of stochastic cellular automata for random and small-world graphs. Journal of Mathematical Psychology, 97, 102380. doi: https://doi.org/10.1016/j.jmp.2020.102380.
- Robinaugh, D. J., Hoekstra, R. H., Toner, E. R., & Borsboom, D. (2020). The network approach to psychopathology: a review of the literature 2008–2018 and an agenda for future research. Psychological Medicine, 50(3), 353-366. doi: https://doi.org/10.1017/S0033291719003404.
- Fried, E. I. (2017). The 52 symptoms of major depression: Lack of content overlap among seven common depression scales. Journal of Affective Disorders, 208, 191-197. doi: https://doi.org/10.1016/j.jmp.2020.102380.